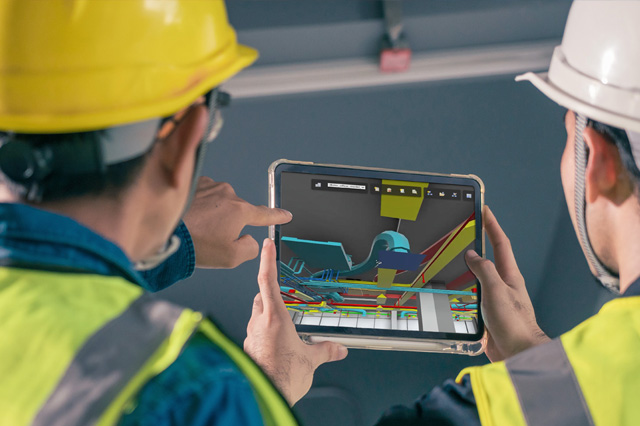
Data Visualisation
Create intuitive, interactive windows on asset operations.
Humans are essentially visual creatures – a large proportion of the brain is dedicated to visual processing, and we can respond to what we see incredibly quickly.
Bringing asset data to life through charts, dashboards, maps and even animations or augmented reality is therefore a powerful and efficient way to communicate complex relationships and deliver data-driven insights in a way that is easy to understand. Interactive visualisations allow stakeholders to explore and discover, quickly understand, interpret and gain important insights into otherwise difficult-to-identify data structures, relationships, patterns and trends.
COSOL’s advanced data visualisation techniques seamlessly integrate data from Enterprise Asset Management (EAM) systems, 3D Building Information Models (BIM) and Geographic Information Systems (GIS) to provide a comprehensive and intuitive representation of assets in a dynamic and interactive environment.
Unlock the full potential of asset management processes and gain a multi-dimensional perspective that empowers smarter decision-making, reduces costs and maximises the value of your asset portfolios.
Applying Visualisation In Asset Operations
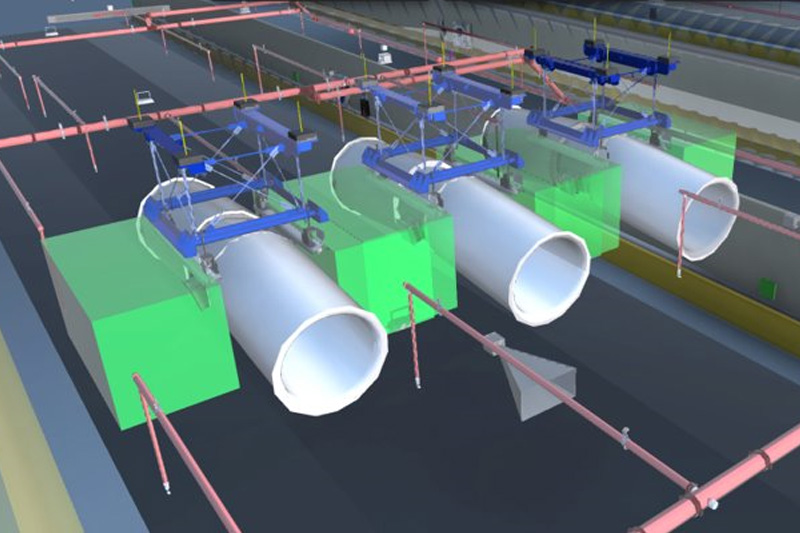
By seamlessly integrating 3D BIM models, stakeholders can visualise assets in their true spatial context, unlocking new insights and understanding of the relationships between assets, infrastructure and the surrounding environment. Leveraging geospatial information enhances asset management processes by overlaying critical data on geographic maps.
The use cases for these visualisations include the following:
- Improved maintenance planning – Graphically plan work execution and create efficient work packages based on spatial proximity, geographical features and environmental factors.
- Enhanced asset information – Use augmented reality to enable work crews to see inside the walls around a work site to locate structural elements and services.
- Inform repair or replace decisions – Thematically display asset health scores to objectively assess asset condition with location context.
- Monitor real-time performance – Build operational dashboards on federated data to visualise current work tasks, completions rates, open/closed works and scheduled jobs and model scenarios in a fully interactive digital twin.
By visualising geospatial data and 3D BIM together, organisations gain a holistic view of their asset portfolios, optimising resource allocation, reducing downtime and maximising operational efficiency.

Data Visualisation Services
COSOL’s data visualisation services include:
- Immersive 3D Visualisation – Experience assets in a highly immersive and realistic 3D environment, enabling better understanding of asset relationships, maintenance requirements and performance metrics.
- Geospatial Integration – Seamlessly integrate geospatial information, such as GPS coordinates, topographic data and satellite imagery, to enhance asset management decision-making based on location-based insights.
- Interactive Dashboards – Access intuitive and customisable dashboards that provide real-time situational awareness, enabling stakeholders to monitor asset performance, analyse trends and make data-driven decisions.
PROMOTE UNDERSTANDING
Enable users to understand complex relationships, spatial configurations and interdependencies more effectively.
IMPROVE DECISION MAKING
By visually analysing data, decision-makers can identify patterns, trends and anomalies, leading to insights that might have remained hidden.
EFFECTIVE COLLABORATION
Shared visualisations foster collaboration by providing a common platform for communication and knowledge sharing.
MITIGATE RISK
Visually identify vulnerabilities in asset infrastructure, informing preventive maintenance planning and proactive risk management.
MANAGE ASSET PERFORMANCE
Visualising performance metrics alongside other data sources enables stakeholders to monitor trends and make data-backed decisions.
INFORM FUTURE PLANNING AND DESIGN
Identify areas for improvement, assess the impact of proposed changes and simulate scenarios to evaluate their feasibility.