
At a glance
- Running lean has limits: Cost-cutting alone is not a long-term asset maintenance strategy.
- Key risk indicators: Backlog trends, breakdown ratios, and defect types help flag under-maintained assets.
- Component risk builds over time: RVIC reveals growing maintenance liabilities as components near failure.
- Balance is key: Sustainable performance comes from aligning cost, performance, and risk—not just reducing spend.
A consultant was with a client recently discussing their annual maintenance budget. Like most Australian mines, cost reduction had been a huge driver of asset strategy over the last few years. And while ‘running lean’ provided much needed cash-flow relief, this is not a long-term strategy if asset performance and safety are to be maintained.
This year, commodity prices have improved, and the cash-flow of this mine is strong. But the continued theme from management was more cost reduction. The problem is that assets may continue to perform well; even when under-maintained for several years. Availability and productivity can be kept high, or at least meet targets, sustained by heroic efforts from the maintenance team…and good luck. It is well understood that these lagging indicators are not sustainable over the asset life cycle unless the right maintenance is performed.
After years of driving down costs and continued good performance, it can be hard to convince management that an increased investment in asset maintenance is needed to keep the assets performing well.
To make the case, it is necessary to look beyond the headline numbers to see what is coming. To demonstrate a need to invest in equipment, the following indicators can be reviewed.
Backlog Work Volume
Backlogs are non-breakdown work orders that have been identified and logged for future completion. Backlog volume is measured as the number of hours required to complete all of the work. A certain level of backlogs is tolerable, and it is rare for the number to be zero. However, what is the trend? Has it increased over time? An increase in the backlog work may indicate that not enough time is being allocated to complete work. You’ll also want to dig deeper in the types of backlogs. Are there may high-priority items outstanding? If so, it’s time to act.
Backlog Ageing
A secondary backlog measure is the age of backlog work, measured as the average number of days backlog work orders have been outstanding. If this number is trending up, the older backlogs should be reviewed to understand why they are there, and why they are not getting done. Old critical work should be highlighted as a priority.
Breakdown Ratio
The ratio of breakdown work to planned work should be reviewed over time. Is the breakdown percentage trending up? If so, it can be a symptom of under-maintaining an asset. This is still a lagging indicator, but this trend will be seen before performance is impacted.
Types of Defects
The number and type of defects being reported should be counted. Are there safety-critical defects continually being reported? Defects relating to broken hand-rails, structural bolts, missing guard, and critical hose failures should be examined. There is no excuse for not addressing these critical items. If these items are being picked up by operators, and not maintained, an urgent review of inspection checklists and processes may also be required.
Are other types of common defects increasing? A high number of hose failures or broken bolts and clamps can indicate basic maintenance is not being performed.
Overdue Components and RVIC
Is the number of overdue components increased over time?
A common strategy to reduce expenditure is to use push component change out points out using a condition-based approach. This will often allow components to exceed their target life and assist in delaying maintenance expenditure, or indeed reducing life cycle cost. However, at some point the components will need to be replaced, or they will fail in service. The number of components that are in this ‘risk zone’ can tell us the overall risk level of the fleet.
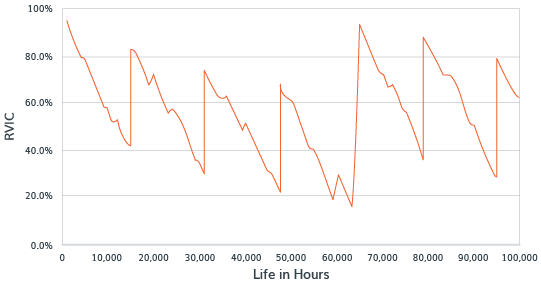
A measure often used to assess this overall maintenance liability is RVIC, or Residual Value in Components. This measure shows the remaining value in components expressed as a percentage of the component replacement value, plotted over asset life. A typical RVIC chart for one mobile asset is shown in the follwing chart.
There is nothing wrong with pursuing a low-cost strategy. The essence of strategy is to balance performance, cost and risk. However, the trick is to ensure the equipment performance is sustainable over the life-cycle. The above metrics will help you identify the risks within your fleet and adjust your maintenance strategy and tactics accordingly.
Book a consultation
Our consultants hold a wealth of industry experience and partner with our clients to build intelligent, sustainable, high-value asset management solutions. Get in touch with us today for a confidential discussion.